
Asset Management Support
Infrastructure Asset maintenance is a key part of the bigger asset management discipline.

Using technology to support Infrastructure Asset Management strategies
Written by Dan Patterson, Product Strategy at BKWAI
The Situation
Infrastructure Asset maintenance is a key part of the bigger asset management discipline. Determining appropriate response(s) to asset degradation helps to uphold the financial and service value of a physical asset.
An asset undergoes a life cycle that typically is represented through 4 stages – planning, acquisition, use and disposal. Each of these phases carries a cost as the example below shows.
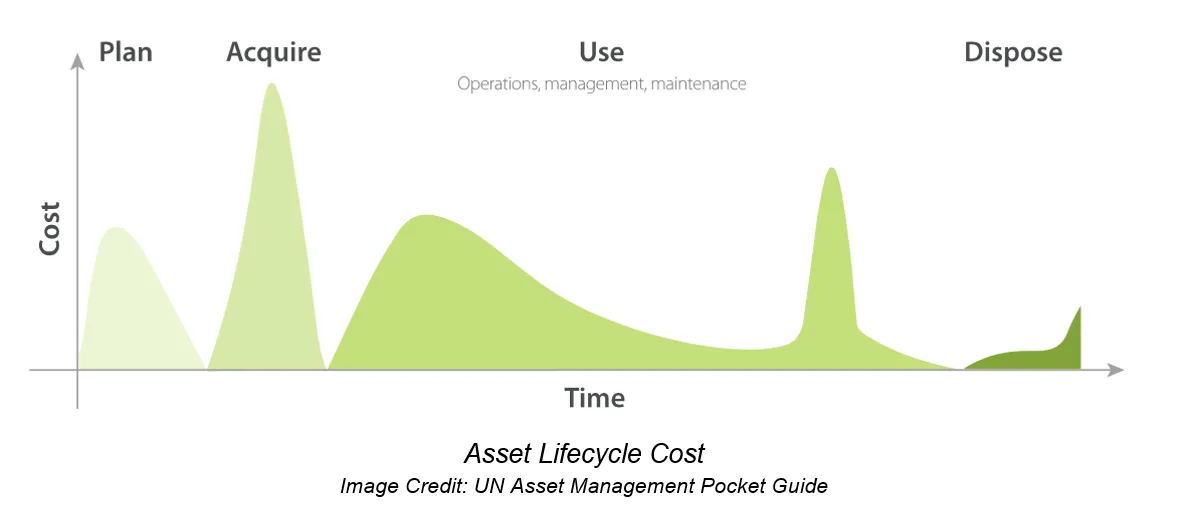
There are well-established disciplines to help forecast and manage these cost phases including project planning for “plan”, construction management for “acquire”, maintenance management for “use” and decommissioning for “dispose”. Solutions like those from BKWAI fall into the discipline of maintenance management to support the “use” phase of the asset lifecycle. The use phase is typically not only the longest phase but also incurs the most cost as well. Understanding these two variables is key to successful asset management.
The Inevitable Asset Deterioration Curve
All assets deteriorate over time. The rate of deterioration is dependent on many influencers including:
- Design characteristics of the asset
- Environmental influencers e.g. normal weather patterns, soil conditions
- Discrete events e.g. earthquakes
- Activity e.g. traffic patterns
These all impact the speed at which an asset deteriorates.
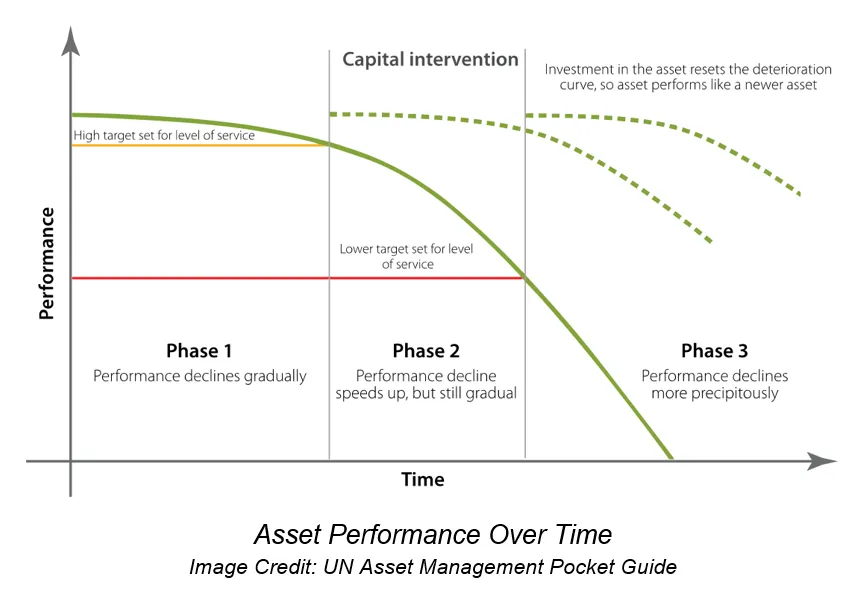
Likewise, the rate of asset deterioration can be slowed down by maintenance intervention – this requires investment. Understanding how much investment is needed and when such investment should be applied is a difficult determination for asset owners to make given the uncertainty pertaining to the true future impact of the asset influencers. In summary, how do we achieve an appropriate mix of interventions in the context of influencers?
Types of Intervention/Maintenance
Maintenance strategies can be classified into three categories:
- Preventative – proactive investment in scheduled maintenance activities resulting in reduction or even avoidance of degradation
- Corrective – repairs to defects of minor impact after they occur
- Reactive – response to a major defect after the fact
Corrective maintenance typically carries a 5x cost multiplier compared to an ongoing preventative maintenance schedule. Worse: a reactive response can be as much as 25 times that of a preventative maintenance plan. So why would an organisation ever not pursue a preventative maintenance plan? The answer boils down to the balance of risk-reward. The greater the forecast time window, the harder it is to predict an asset’s behaviour and how it will actually respond to its influencers e.g. 5 years from now, what will be the vertical movement on a pier? This makes the true determination of risk very hard to accurately predict.
If asset owners had greater visibility into the future state of their investments as well as a greater degree of confidence that the predicted state is indeed accurate, then the challenge of determining how much to spend on preventative maintenance becomes much more straightforward.
Using Data Science to supplement decision making
Using a predictive engine powered by data science algorithms allows us to forecast a future state by analysing historical trends and extrapolating these forwards to generate a predicted state at a given point in time. Achieving an accurate forecast can be complex depending on the number and magnitude of external influencers e.g. weather.
The more influencer dimensions available to the engine, the higher the degree of certainty that can be assumed from the model. Today, amongst other factors, weather and temperature influences help to better normalise forecasts.
By understanding the impact of preventative maintenance and comparing this to a strategy that rests its outcome on hoping corrective action isn’t required, we can easily calculate the ROI of these two strategies. From this, an informed decision can be made as to which strategy is most cost-effective.
Consider two simple scenarios: the preventative maintenance strategy and the corrective maintenance strategy.
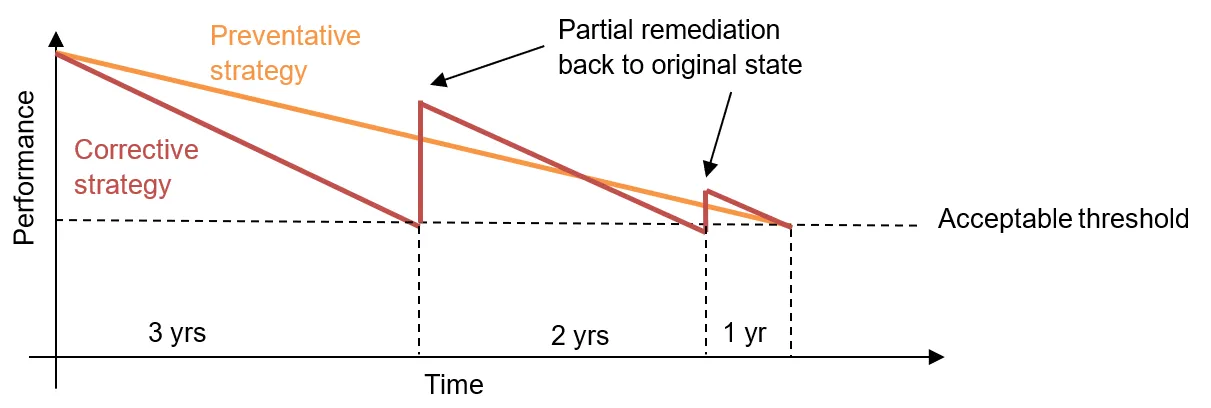
In the example above, both strategies give us a 6-year asset life. So which strategy should we adopt?
| Strategy | Yearly preventative cost | Corrective costs | Total cost |
|---|---|---|---|
| Corrective strategy | $0 | 2 × $1MM | $2MM |
| Preventative strategy | $200,000 | End of year 6 | $1.2MM |
Both strategies result in the same lifespan but the preventative strategy is $800K cheaper and results in better cashflow after year 3.
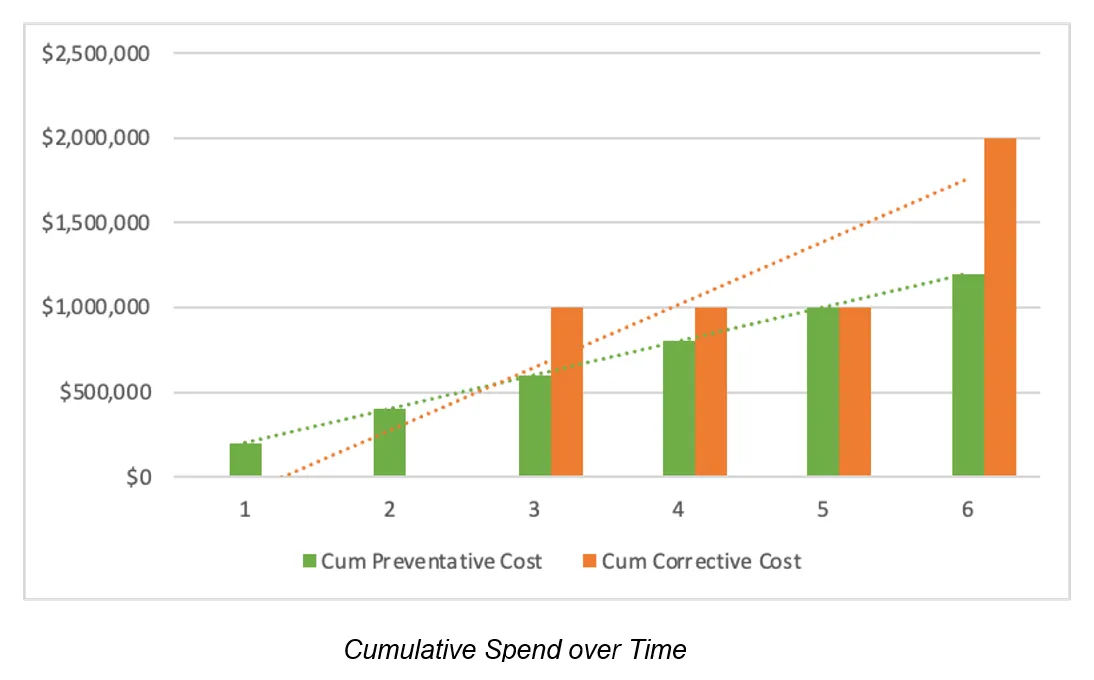
These simple models can be even more valuable when we add the dimension of certainty (or conversely, risk) to the equation. By modelling certainty of factors such as spend, effectiveness of corrective and preventative work on the performance of the asset, we can then start to report in the context of certainty as well. For example, a typical organisation will make decisions within the context of a given confidence or P value. Outcomes from different maintenance strategies will vary depending on the P-value adopted.
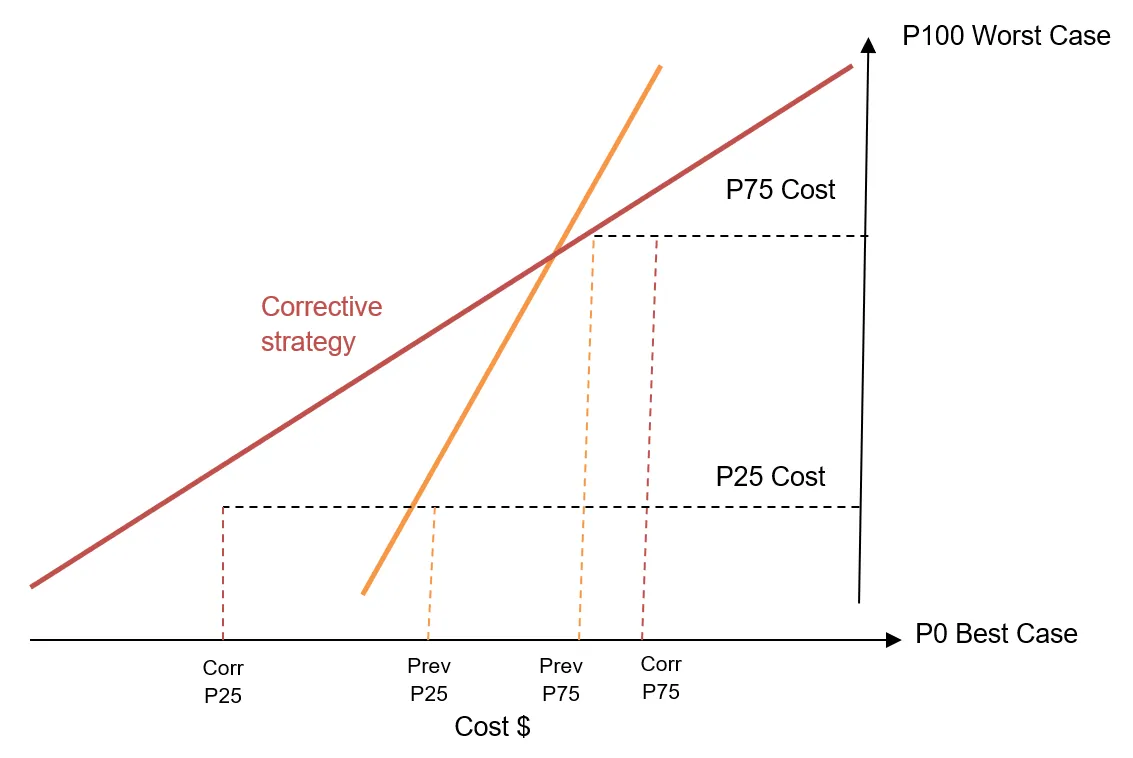
In the example above, a risk-averse organisation (one that adopts a high-certainty outcome e.g. P75) is better off adopting a preventative maintenance strategy (from a cost perspective).
Conversely, a more risk-tolerant organisation (willing to adopt a lower confidence of success e.g. P25) is better off adopting the corrective strategy.
Having such insight into alternate scenarios and outcomes is something that is very difficult to effectively achieve on paper or even in XLS-based models.
This is where products like those from BKWAI enable the merging of historical trend interrogation and predictive analytics to deliver powerful decision support to asset owners and operators.
To find out how BKWAI can enable you to make smarter decisions please contact us
More insights
-
 Insight ·
Geospatial Analytics
Asset and construction monitoring has evolved at an arguably slow pace over the past few centuries.
7 min read -
 Insight ·
Climate Change
As the last few months of weather have adequately demonstrated, our weather is changing and is becoming ever more extreme.
4 min read -
 Insight ·
Site Monitoring
According to the June 2022 Geotechnical Instrumentation and Monitoring Market report, the 2022 global spend on geotech instrumentation and monitoring will top US$3B.
5 min read
See what BKWAI can see on your assets.
Let's discuss how predictive monitoring can reduce your whole-life asset costs.